Chapter 2 Social Class
Learning Objectives
- 2.1 Explain the different definitions of poverty
- 2.2 Compare the four sociological perspectives on social class and poverty
- 2.3 Identify two consequences of poverty
- 2.4 Explain the evolution of U.S. welfare policy
- 2.5 Assess whether life after welfare has improved after the passage of PRWORA
The United States is perceived as one of the world’s richest countries. Nonetheless, economic inequality is one of the most important and visible of America’s social problems (McCall 2002). President Barack Obama identified “the combined trends of increased inequality and decreasing mobility” as “the defining challenge of our time” (White House 2013). Sociologists Steve McNamee and Robert Miller (2014) observe:
Opinion polls consistently show that Americans continue to embrace the American Dream. But as they strive to achieve it, they have found that it has become more difficult simply to keep up and make ends meet. Instead of “getting ahead”, Americans often find themselves working harder just to stay in place, and despite their best efforts, many find themselves “falling behind”—worse off than they were earlier in their lives or compared to their parents at similar points in their lives. (p. 217)
Many Americans believe that their economic status is declining or not improving at all and that there is increasing tension between the rich and the poor (Pew Research Center 2008; Drake 2013). Almost 80% of those surveyed by the Pew Research Center (2008) said that it had been more difficult over the past five years for middle-class people to maintain their standard of living. About two thirds of the 2012 Pew Research Center sample agree that the rich are getting richer and the poor are getting poorer, and more than half believe it is a bad thing for our society (Drake 2013).
In this chapter, we will examine how the overall distribution of wages and earnings has become more unequal and how the distance between the wealthy and the poor has widened considerably in recent decades and worsened during the Great Recession of 2007–2009. The Occupy Wall Street movement highlighted wealth and income inequality through its central protest question: Are you a member of the wealthy 1% or part of the remaining 99%? Martin Marger (2002) writes, “Measured in various ways, the gap between rich and poor in the United States is wider than [in] any other society with comparable economic institutions and standards of living” (p. 48).
According to the U.S. Census, for 2013 the median income was $51,939 (DeNavas-Walt and Proctor 2014). The U.S. Census examines income distribution by dividing the U.S. household population into fifths or quintiles. If all U.S. income were equally divided, each quintile would receive one fifth of the total income. However, based on U.S. Census data for 2013, 51% of the total U.S. income was earned by households in the highest quintile or among households making an average of $185,206. The lowest 20% of households (earning an average of $11,651 per year) had 3.2% of the total income (DeNavas-Walt and Proctor 2014). Inequality first grew between 1973 and 1999, when the top fifth of the distribution began to increase its share of aggregate income, while the bottom four fifths began to lose their share (Jones and Weinberg 2000). A report by the U.S. Congressional Budget Office (2011) revealed that the income for the top 1% increased by 275% from 1979 to 2007. (Refer to Table 2.1.)
Wealth, rather than income, may be more important in determining one’s economic inequality. Wealth is usually defined as the value of assets (checking and savings accounts, property, vehicles, and stocks) owned by a household (Keister and Moller 2000) at a point in time. Wealth is measured in two ways: gross assets (the total value of the assets someone owns) and net worth (the value of assets owned minus the amount of debt owed) (Gilbert 2003). Wealth is more stable within families and across generations than is income, occupation, or education (Conley 1999) and can be used to secure or produce wealth, enhancing one’s life chances.
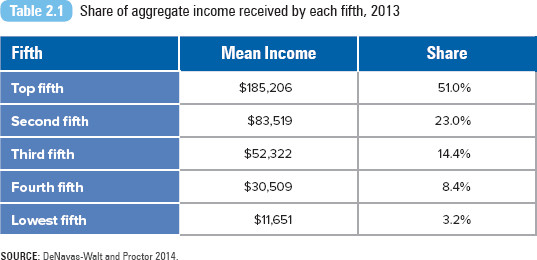
SOURCE: DeNavas-Walt and Proctor 2014.
As Melvin Oliver and Thomas Shapiro (1995) explain,
Wealth is a particularly important indicator of individual and family access to life chances. Wealth is a special form of money not used to purchase milk and shoes and other life necessities. More often it is used to create opportunities, secure a desired stature and standard of living, or pass class status along to one’s children. . . . The command over resources that wealth entails is more encompassing than income or education, and closer in meaning and theoretical significance to our traditional notions of economic well-being and access to life chances. (p. 2)
Wealth preserves the division between the wealthy and the nonwealthy, providing an important mechanism for the intergenerational transmission of inequality (Gilbert 2003). Scott Sernau (2001) tells us,
Wealth begets wealth. . . . It ensures that those near the bottom will be called on to spend almost all of their incomes and that what wealth they might acquire, such as an aging automobile or an aging house in a vulnerable neighborhood, will more likely depreciate than increase in value, and the poor will get nowhere. (p. 69)
Data reveal that wealth is more unequally distributed and more concentrated than income. Since the early 1920s, the top 1% of wealth holders have owned an average of 30% of household wealth. During the late 1980s and 1990s, the top 1% of wealth owners owned more than 45% of all net worth and nearly 50% of all financial assets (Keister and Moller 2000; Wolff 2006). From 2007 to 2010, the proportion of families that reported they had saved money in the previous year fell from 56.4% to 52%. During the same period, median net worth decreased for all income groups except the top 10% (Bricker et al. 2012).
Richard Fry and Rakesh Kochhar (2014) reported how the wealth gap between upper-income and middle-income Americans reached its highest level on record in 2013. The median wealth of upper-income families ($639,400) was 6.6 times greater than the median wealth of middle-income families ($96,500). The wealth ratio is 70 times larger between upper-income and lower-income Americans ($9,300). Fry and Kochhar attribute the decline in middle-class and lower-class family wealth to the Great Recession of 2007–2009, describing these families as “financially stuck” and stating that “the economy recovery has yet to be felt for them.”

The Growing Wage Gap
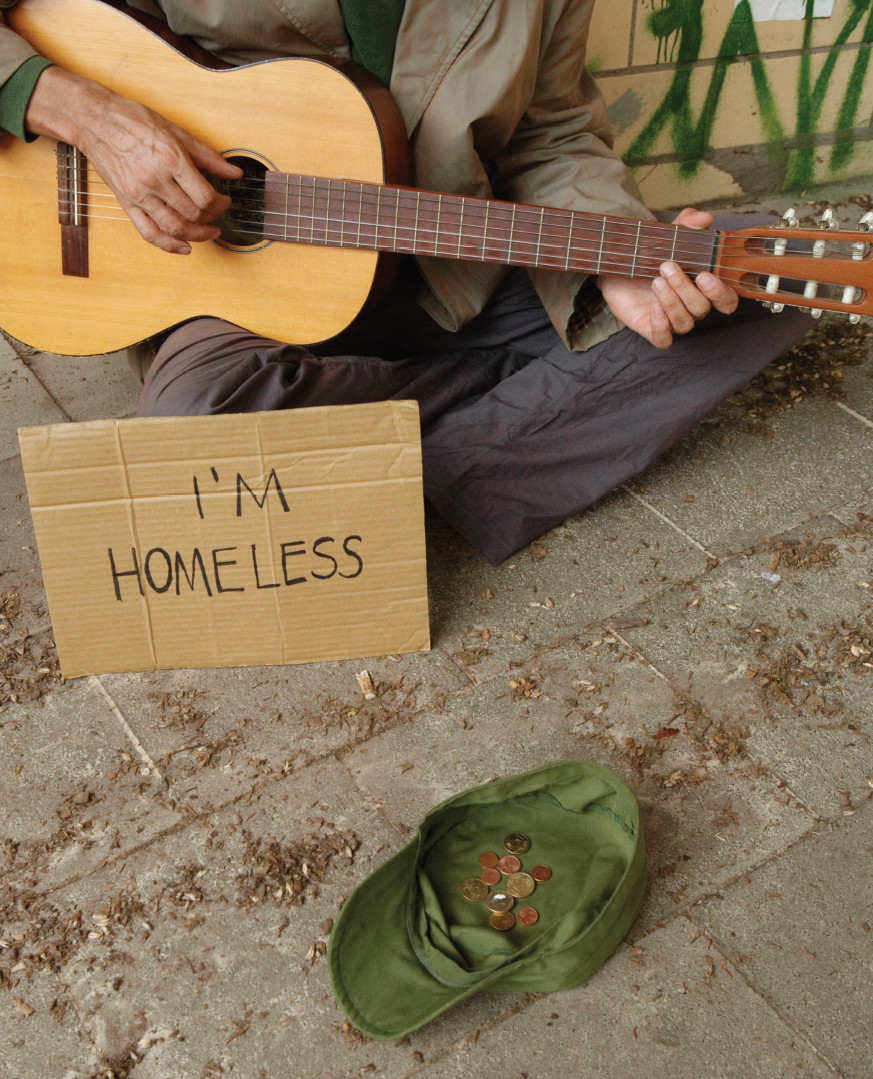
What Does It Mean to Be Poor?
The often-cited definition of poverty offered by the World Bank is an income of $1.25 per day. This represents “extreme poverty,” the minimal amount necessary for a person to fulfill his or her basic needs. According to the organization (World Bank 2009),
Poverty is hunger. Poverty is lack of shelter. Poverty is being sick and not being able to see a doctor. Poverty is not being able to go to school and not knowing how to read. Poverty is not having a job, is fear for the future, living one day at a time. Poverty is losing a child to illness brought about by unclean water. Poverty is powerlessness, lack of representation and freedom.
Due to significant improvements in education, gender equality, health care, environmental degradation, and hunger, there has been a decline in both the overall poverty rate and the number of poor according to the World Bank (2012). For 1981, a total of 1.94 billion people (or 52% of the population) in the developing world had consumption levels below $1.25. In 2008, the number had declined to 1.29 billion (or 22%), where it remains today.
Sociologists offer two definitions of poverty, absolute and relative poverty. Absolute poverty refers to a lack of basic necessities, such as food, shelter, and income. Relative poverty refers to a situation in which some people fail to achieve the average income or lifestyle enjoyed by the rest of society. Our mainstream standard of living defines the “average” American lifestyle. Individuals living in relative poverty may be able to afford basic necessities, but they cannot maintain a standard of living comparable to that of other members of society. Relative poverty emphasizes the inequality of income and the growing gap between the richest and poorest Americans. A definition reflecting the relative nature of income inequality was adopted by the European (EU) Council of Ministers: “The poor shall be taken to mean persons, families and groups of persons whose resources (material, cultural and societal) are so limited as to exclude them from the minimum acceptable way of life in the member state in which they live” (European Commission 1985).
The Federal Definitions of Poverty
There are two federal policy measures of poverty: the poverty threshold and the poverty guidelines. These measures are important for statistical purposes and for determining eligibility for social service programs.
The poverty threshold is the original federal poverty measure developed by the Social Security Administration and updated each year by the U.S. Census Bureau. The threshold is used to estimate the number of people in poverty. Originally developed by Mollie Orshansky for the Social Security Administration in 1964, the original poverty threshold was based on the economy food plan, the least costly of four nutritionally adequate food plans designed by the U.S. Department of Agriculture (USDA). Based on the 1955 Household Food Consumption Survey, the USDA determined that families of three or more people spent about one third of their after-tax income on food. The poverty threshold was set at three times the cost of the economy food plan. The definition of the poverty threshold was revised in 1969 and 1981. Since 1969, annual adjustments in the levels have been based on the consumer price index (CPI) instead of changes in the cost of foods in the economy food plan.
The poverty threshold considers money or cash income before taxes and excludes capital gains and noncash benefits (public housing, Medicaid, and the Supplemental Nutrition Assistance Program). The poverty threshold does not apply to people residing in military barracks or institutional group quarters or to unrelated individuals younger than age 15 (foster children). In addition, the definition of the poverty threshold does not vary geographically.
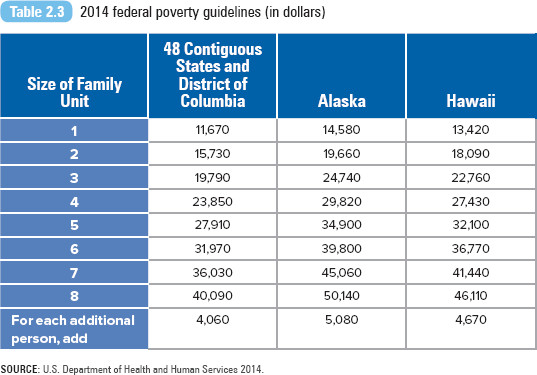
The poverty guidelines, issued each year by the U.S. Department of Health and Human Services, are used to determine family or individual eligibility for federal programs such as Head Start, the National School Lunch Program, or the Low Income Home Energy Assistance Program. The poverty guidelines are designated by the year in which they are issued. For example, the guidelines issued in January 2014 are designated as the 2014 poverty guidelines, but the guidelines reflect price changes through the calendar year 2013. There are separate poverty guidelines for Alaska and Hawaii. The current poverty threshold and guidelines are presented in Tables 2.2 and 2.3.
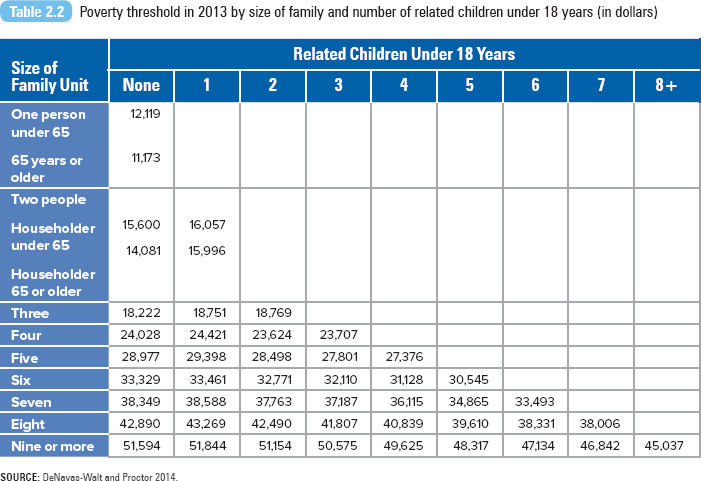
SOURCE: DeNavas-Walt and Proctor 2014.
Who Are the Poor?
In 2011, the poverty rate was 14.5%, or 46.2 million, compared with the most recent low poverty rate of 11.3%, or 31.6 million, in 2000 (DeNavas-Walt, Proctor, and Smith 2007; DeNavas-Walt and Proctor 2014). This is the first decrease in the rate since 2006. (Refer to this chapter’s Exploring Social Problems feature for a summary of poverty statistics for 2013.)
Based on 2013 U.S. poverty figures and redefined racial and ethnic categories, Whites (who reported being White and no other race category, along with Whites who reported being White plus another race category) compose the largest group of poor individuals in the United States. Though 41.5% of the U.S. poor are non-Hispanic Whites, the poverty rate for non-Hispanic Whites is the lowest, at 9.9%. Blacks continue to have the highest poverty rate, 27.2%, followed by Hispanics with a rate of 23.5% (DeNavas-Walt and Proctor 2014). Analysts predict that within a few years, Latinos will have a higher poverty rate than Blacks. Racial segregation and discrimination have contributed to the high rate of minority poverty in the United States. Minority groups are disadvantaged by their lower levels of education, lower levels of work experience, lower wages, and chronic health problems—all characteristics associated with higher poverty rates (Iceland 2003).
According to the National Center for Children in Poverty (2001), children are more likely to live in poverty than Americans in any other age group. Family economic conditions affect the material and social resources available to children. The quality of their education, the neighborhood environment, and exposure to environmental contaminants may reinforce and widen the gaps between poorer and more affluent children and adults (Holzer et al. 2008).
Figure 2.4 The percentage of children (aged 0 to 17) living in households with income below 50% of the national median income, 2013
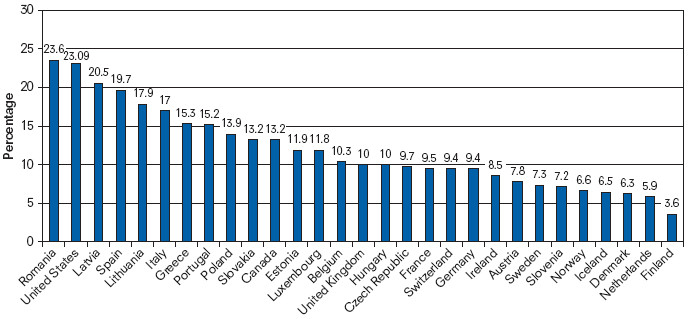
SOURCE: Adapted from UNICEF Office of Research 2013.
The poverty rate among children is higher in the United States than in most other major Western industrialized nations. In 2013, the United Nations Children’s Fund (UNICEF) released its report on child well-being in rich countries, identifying the percentage of children living in relative poverty (in households with income below 50% of the national median income). Romania ranks highest at 23.6%, followed by the United States at 23.09%. (Refer to Figure 2.4 for additional data.) The lowest relative child poverty rate is in Finland (3.6%).
The poverty rate for U.S. children peaked in 1993 at 22.5%. In 2013, the poverty rate among children was 19.9% (DeNavas-Walt et al. 2007; DeNavas-Walt and Proctor 2014). The risk of being poor remains high among specific groups. In 2012, there were more poor Hispanic children (5.8 million) than poor Black (4.1 million) or poor White non-Hispanic children (5.2 million). More than two thirds of poor children lived in families with at least one working family member. There remains a wide variation in children’s poverty rates among states; in 2012, rates ranged from 13.2% in North Dakota to 34.7% in Mississippi among children under age 18 (Children’s Defense Fund 2014).
In 2013, families with a female householder and no spouse present were more likely to be poor than were families with a male householder and no spouse present, 30.6% versus 15.9%. In contrast, the poverty rate for married-couple families was 5.8% (DeNavas-Walt and Proctor 2014). Single-parent families are more vulnerable to poverty because there is only one adult income earner, and female heads of household are disadvantaged even further because women in general make less money than men do.
In their analysis of data from the Luxembourg Income Study, Lee Rainwater and Timothy Smeeding (2003) concluded that American single mothers’ children fare worse than the majority of their global counterparts. The poverty rate among U.S. children living in single-mother families is close to 50%; the rate is slightly lower in Germany (48%) and Australia (46%). Countries with poverty rates below 20% include Sweden (7%), Finland (8%), Denmark (11%), Belgium (13%), and Norway (14%). Generous social wage (e.g., unemployment) and social welfare programs reduce the poverty rate in these Nordic countries. Rainwater and Smeeding note that, all combined, U.S. wage and welfare programs are much smaller than similar programs in other countries.
Poverty rates vary across geographic areas because of differences in person-specific and place-specific characteristics (Levernier, Partridge, and Rickman 2000). A region may have a higher rate of poverty because it contains disproportionately higher shares of demographic groups associated with greater poverty, such as racial/ethnic minority groups, female heads of household, and low-skilled workers. Area poverty is also related to place-specific factors, such as the region’s economic performance, employment growth, industry structure, and cost of living.
There is an additional category of poverty—the working poor. These are men and women who have spent at least 27 weeks working or looking for work, but whose incomes have fallen below the official poverty level. For 2012, there were 10.6 million working poor (U.S. Bureau of Labor Statistics 2014). Black and Hispanic workers were more than twice as likely as White or Asian workers to be working poor. Individuals with less than a high school diploma were more likely to be classified as working poor than college graduates are. Service occupations accounted for one third of all those classified as working poor (U.S. Bureau of Labor Statistics 2014).
David Brady, Andrew Fullerton, and Jennifer Moren Cross (2010) compared the status of the working poor in the United States to that of 17 other affluent Western democracies. The rate of working poverty was highest in the United States (14.5% of the population). Belgium had the lowest rate of working poor at 2.23%. The sociologists documented how several demographic characteristics were related to the likelihood of being working poor—individuals from households with one income earner, with more children, or with a young household head with low educational attainment.
Exploring social problems
Who Is Poor?
U.S. Data Map 2.1 Percentage of people in poverty by state, two-year average 2012–2013
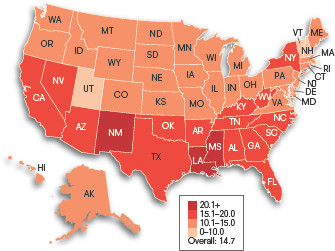
SOURCE: DeNavas-Walt and Proctor 2014.
Figure 2.1 Percentage below poverty level by gender, 2013
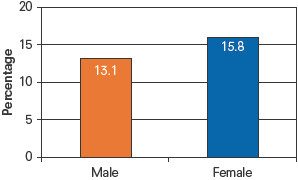
SOURCE: DeNavas-Walt and Proctor 2014.
Figure 2.2 Percentage below poverty by age, 2013
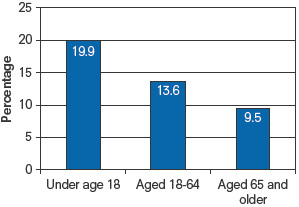
SOURCE: DeNavas-Walt and Proctor 2014.
Figure 2.3 Percentage below poverty by race and ethnicity, 2013
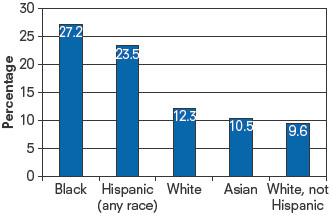
SOURCE: DeNavas-Walt and Proctor 2014.
What Do You Think?
In 2012–2013, the South had the highest poverty rate (16.1%), followed by the West (14.7%), the Midwest (12.9%), and the Northeast (12.7%) (DeNavas-Walt and Proctor 2014). The states with the highest two-year average poverty rates were Louisiana, New Mexico, and Mississippi. The variation in regional rates of poverty may be due to people-specific characteristics (percentage of racial/ethnic minorities, female heads of households) or characteristics based on place (labor market, cost of living).
As discussed in this chapter, your social position determines your life chances of being poor. Groups most likely to experience poverty in the United States are women (especially female householders with no husband present), children, or ethnic/racial minorities (refer to Figures 2.1 through 2.3).
Why are these groups more susceptible to poverty than other groups?
Taking a World View

Income Inequality in China
China’s income inequality provides an interesting contrast with U.S. inequality. A 2012 survey conducted by Peking University’s Chinese Family Panel Studies revealed that households in the top 5% of the income bracket earned 23% of China’s total household income, while households in the lowest 5% earned 0.1% of the total income. Average annual income for a family was about $2,100 (converted into U.S. dollars). Average family income was higher for urban families ($2,600) compared to rural families ($1,600) (Wong 2013).
Shi Li, Hiroshi Sato, and Terry Sicular (2013) identify the role of strong structural forces that continue to shape China’s income inequality. They describe two sources of inequality rooted in government practices and regulations.
One source is the persistent divide between urban and rural populations, regulated by China’s household registration system, also known as the hukou system, established during the Maoist era in the late 1950s. The hukou system serves as an internal passport mechanism to control domestic population movements, limiting migration from rural to urban areas. Since the mid-1990s, as China has moved toward more democratic reforms, Community Party leaders have revised hukou to make it easier for rural migrants to move into urban areas and obtain higher-paying jobs. Yet there are still structural barriers—expensive housing, lack of public services, and lack of health care access—limiting the permanent relocation of rural workers. As a result, rural-to-urban migration is often temporary (Sicular 2013).
Another source of income inequality has been the creation of private property acquisition (Li, Sato, and Sicular 2013). During the Maoist era, private property ownership was prohibited. Laws in the 1990s allowed private property ownership, most of it in urban real estate markets. Complementary legislation also allowed private business ownership. While these policies have lifted many Chinese out of poverty, the privatization of property and business ownership fueled wealth accumulation among urban dwellers and an already privileged upper class (Sicular 2013). According to the Chinese Family Panel Studies, more than 87% of families owned or partially owned property in 2012 (Wong 2013). Recently, the Chinese government tightened banking and real estate policies in an effort to control a booming real estate market. In 2013, single-person households were banned from buying more than one residence in Beijing, the country’s capital.
Summarize how structural forces continue to shape China’s income inequality.
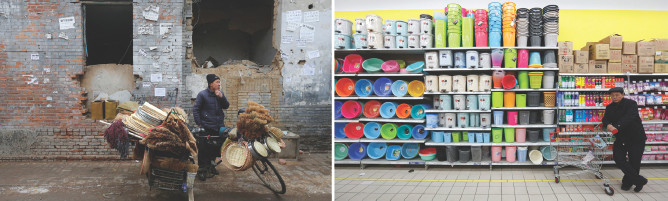
Though most of China’s citizens have increased their household income and standard of living, poverty still exists in the country. According to the United Nations, about 12 percent of the country lives on less than $1.25 per day.
KIM KYUNG-HOON/REUTERS
Kim Kyung-Hoon/Reuters
Sociological Perspectives on Social Class and Poverty
Why do some prosper while others remain poor? Why does poverty persist in some families, but other families are able to improve their economic situation? In the next section, we will review the four sociological perspectives to understand the bases of class inequality.
Functionalist Perspective
Functionalists assume that not everyone in society can and should be equal. From this perspective, inequality is necessary for the social order, and it is equally important how each of us recognizes and accepts our status in the social structure. Erving Goffman (1951), an interactionist, offers a functional explanation of social stratification, defining it as a universal characteristic of social life. Goffman argues that as we interact with one another, accepting our status in society and acknowledging the status of others, we provide “harmony” to the social order. But “this kind of harmony requires that the occupant of each status act towards others in a manner which conveys the impression that his conception of himself and of them is the same as their conception of themselves and him” (Goffman 1951:294).
Functionalists contend that some individuals are more important to society because of their function to society. For example, society values the lifesaving work of a medical surgeon more than the retail function of a grocery store cashier. Based on the value of one’s work or talent, society rewards individuals at the top of the social structure (surgeons) with more wealth, income, or power than those lower down in the social structure (grocery cashiers). According to this perspective, individuals are sorted according to their abilities or characteristics—their age, strength, intelligence, physical ability, or even sex—to play their particular role for society. Certain individuals are better suited for their positions in society than others. Our social institutions, especially education, sort everyone into their proper places and reward them accordingly. Because not all of us can (or should) become surgeons, the system ensures that only the most talented and qualified become surgeons. In many ways, the functionalist argument reinforces the belief that we are naturally different.
Functionalists observe that poverty is a product of our social structure. Specifically, rapid economic and technological changes have eliminated the need for low-skilled labor, creating a population of workers who are unskilled and untrained for this new economy. In many ways, theorists from this perspective expect this disparity among workers, arguing that only the most qualified should fill the important jobs in society and be rewarded for their talent.
Herbert Gans (1971) argued that poverty exists because it is functional for society. Gans explained that the poor uphold the legitimacy of dominant norms. The poor help reinforce cultural ideals of hard work and the notion that anyone can succeed if only he or she tries (so if you fail, it is your fault). Poverty helps preserve social boundaries. It separates the haves from the have-nots by their economics and according to their educational attainment, marriage, and residence. The poor also provide a low-wage labor pool to do the “dirty work” that no one else wants to do. Gans (1995) maintained that the positive functions of poverty should be considered in any antipoverty policy.
Our social welfare system, designed to address the problem of poverty, has been accused of being dysfunctional itself; critics suggest that the welfare bureaucracy is primarily concerned with its own survival. Poverty helps create jobs for the nonpoor, particularly the social welfare system designed to assist the poor. As a result, the social welfare bureaucracy will develop programs and structures that will only ensure its survival and legitimacy. Based on personal experience working with and for the system, Theresa Funiciello (1993) observed, “Countless middle class people were making money, building careers, becoming powerful and otherwise benefiting from poverty. . . . The poverty industry once again substituted its own interests for that of poor people” (p. xix). We will discuss this further in the next perspective.
Conflict Perspective
Like the functionalist perspective, the conflict perspective argues that inequality is inevitable, but for different reasons. For a functionalist, inequality is necessary because of the different positions and roles needed in society. From a conflict perspective, inequality is systematically created and maintained by those trying to preserve their advantage over the system.
For Karl Marx, one’s social class is solely determined by one’s position in the economic system: You are either a worker or an owner of the means of production. Nancy Kreiger, David Williams, and Nancy Moss (1997) offer this explanation of class:
Class, as such, is not an priori property of individual human beings, but is a social relationship created by societies. One additional and central component of class relations involves an asymmetry of economic exploitation, whereby owners of resources (e.g. capital) gain economically from the labor effort of non-owners who work for them. (p. 346)
But social class, according to Max Weber, is multidimensional. Economic factors include income, the money earned for one’s work, and wealth, the value of one’s personal assets such as savings and property. A person’s social class is also influenced by prestige, the amount of social respect or standing given to an individual based on occupation. We assign higher prestige to occupations that require specialized education or training, that provide some social good to society, or that make more money. A final component of class is power. Weber defined power as the ability to achieve one’s goals despite the opposition of others. Power is the ability to do whatever you want because no one can stop you.
Power is not limited to individuals. People with similar interests (or with similar income, wealth, and prestige backgrounds) often collaborate to increase their advantage in society. C. Wright Mills ([1959] 2000) argued that the United States is ruled by what he called a power elite. According to Mills, this elite group is composed of business, political, and military leaders. This elite group has absolute power because of its ability to withhold resources and prevent others from realizing their interests. Mills identified how the power elite effectively make decisions regarding economic policy and national security—controlling the difference between a boom economy and a bust economy or peace and war abroad (Gilbert 2003). Refer to this chapter’s In Focus feature for an in-depth look at the modern power elite.
Michael Harrington (1963) argues, “The real explanation of why the poor are where they are is that they made the mistake of being born to the wrong parents, in the wrong section of the country, in the wrong industry, or in the wrong racial or ethnic group” (p. 21). Inequalities built into our social structure create and perpetuate poverty. As Manning Marable (2000) states, capitalism is fraud. Although it promotes the idea that everyone has a fair and equal chance to succeed, advantages are given to members of particular groups based on their gender, race, or social class.
Conflict theorists assert that poverty exists because those in power want to maintain and expand their base of power and interests, with little left to share with others. Welfare bureaucracies—local, state, and national—represent important interest groups that influence the creation and implementation of welfare policies. A welfare policy reflects the political economy of the community in which it is implemented (Handler and Hasenfeld 1991).
Francis Fox Piven and Richard A. Cloward (1993) conclude that the principal function of welfare is to allow the capitalist class to maintain control over labor. Welfare policy has been used by the state to stifle protest and to enforce submissive work norms. During periods of economic crisis, the state expands welfare rolls to pacify the poor and reduce the likelihood of serious uprising. However, during economic growth or stability, the state attempts to reduce the number of people on welfare, forcing the poor or dislocated workers back into the expanding labor force. Those who remain on welfare are condemned and stigmatized for their dependence on the system. For example, in 2011, more than 36 states considered drug testing for Temporary Assistance for Needy Families (TANF) recipients (Sulzberger 2011).
Opponents of this policy argue that punitive testing policies perpetuate the stereotype that people on public assistance are morally corrupt and more likely to use drugs. It also distracts from the need for and access to drug treatment and prevention. A 2012 assessment of the Florida welfare drug test law revealed that there were no direct savings for the state; contrary to the law’s intent, it did not identify many drug users and had no effect on reducing the number of individuals applying for welfare assistance (Alvarez 2012). The Florida law was struck down by a federal appeals court in 2014; the court ruled that the state failed to demonstrate that drug abuse was more prevalent or unique among TANF clients than the general population.

Race and the Wealth Gap
Drug Testing
Feminist Perspective
Feminist scholars define the welfare state as an arena of political struggle. The drive to maintain male dominance and the patriarchal family is assumed to be the principal force shaping the formation, implementation, and outcomes of U.S. welfare policy (Neubeck and Cazenave 2001).
Social welfare scholar Mimi Abramovitz (1996) notes that welfare has historically distinguished between the deserving poor (widows with children) and the undeserving poor (single and divorced mothers). In the 1970s and 1980s, media and politicians created the image of the “Cadillac driving, champagne sipping, penthouse living welfare queens” (Zucchino 1999:13), suggesting that women—specifically, single mothers—were abusing welfare assistance. Women were accused of having more children to avoid work and to increase their welfare benefits. Marriage, hard work, honesty, and abstinence were offered as solutions to their poverty. The negative stereotypes of poor women stigmatized these women and fueled support for punitive social policies (Abramovitz 1996), and they continue to be a part of welfare policies today.
The bias against women is reproduced systematically in our social institutions. Fraser (1989) argues that there are two types of welfare programs: masculine programs related to the labor market (social security, unemployment compensation) and feminine programs related to the family or household (Aid to Families with Dependent Children [AFDC], food stamps, and Medicaid). The welfare system is separate and unequal. Fraser believes that masculine programs are rational, generous, and nonintrusive, whereas feminine programs are inadequate, intrusive, and humiliating. The quintessential program for women, AFDC, institutionalized the feminization of poverty by failing to provide adequate support, training, and income to ensure self-sufficiency for women (Gordon 1994). The program operated from 1935 to 1996.
Our current welfare system, the Personal Responsibility and Work Opportunity Reconciliation Act (PRWORA) and its TANF program, have been criticized for its treatment of women and their families. PRWORA created a pool of disciplined low-wage laborers: women who must take any job that is available or find themselves and their families penalized by the government (Piven 2002). With its emphasis on work as the path to self-sufficiency, TANF forces women back to the same low-pay, low-skill jobs that may have led them to their poverty in the first place (Lafer 2002; Gilman 2012). The new program requirements, as Debra Henderson, Ann Tickamyer, and Barry Tadlock (2005) argue, also deny women the choice to be full-time mothers. Eligibility guidelines force poor women to work, making them choose between the competing roles of good mother and good welfare recipient. The new policies fail to address the real barriers facing women: low job skills and educational attainment, racism and discrimination in the labor market, and the competing demands of work and caring for their children.
In Focus

The Power of Political Action Committees
G. William Domhoff (2002) argues that real power is distributive power, the power individuals or groups have over other individuals or groups. Power matters when a group has the ability to control strategic resources and opportunities to obtain such resources. Money, land, information, and skills are strategic resources when they are needed by individuals to do what they want to do (Hachen 2001). Domhoff argues that distributive power is limited to an elite group of individuals whose economic, political, and social relationships are closely interrelated. Control over four major social networks—economic, political, military, and religious—can be turned into a strong organizational base for wielding power (Mann 1986).
Political action committees (PACs) have been characterized as extensions of the influence of the power elite. While contributions to a candidate’s campaign are limited to $2,500 per election from each individual donor, PACs, or super PACs as they are more often referred to, can collect unlimited amounts from individuals and corporations. In 1947, corporations were banned from using their profits to endorse or oppose political candidates; however, in 2010, the U.S. Supreme Court ruled the restriction unconstitutional and allowed corporations the same rights as individuals when it comes to political speech (the donation of money).
Campaign-finance reform activists predicted that the ruling would increase the influence of special interest groups, allowing what has been characterized as a corruption of our democracy or corporate electioneering. Though PACs cannot formally coordinate their activities or communicate exclusively with candidates, PACs are closely aligned with candidates and important sources for campaign money. For example, Sheldon and Miriam Adelson donated $10 million to Winning Our Future, the PAC that supported Newt Gingrich’s 2012 presidential campaign. The Adelsons are longtime friends and supporters of Gingrich. Their contribution was described as leveling the political playing field between Gingrich and Governor Mitt Romney in critical primaries in Florida and South Carolina (Confessore 2012). The Adelsons supported Restore Our Future, Romney’s PAC.
Another influential political coalition is the group of organizations known as the 527s, independent political groups named for a section of the Internal Revenue Service tax code that regulates the financial activities of all political groups. Like PACs, there are no restrictions on contributions to 527s. During the 2004 presidential election, Senator John Kerry was targeted by the 527 Swift Boat Veterans for Truth, who falsely attacked his Vietnam service record. The campaign was so memorable that the term swift boating has come to refer to an untrue or unfair political attack.
Interactionist Perspective
An interactionist would draw attention to how class differences are communicated through symbols, how the meaning of these symbols is constructed or constrained by social forces, and how these symbols reproduce social inequality. Our language reflects the quality of life that is associated with different amounts of economic resources. We distinguish the “very rich” from the “stinking rich” and someone who is “poor” from someone who is “dirt poor” (Rainwater and Smeeding 2003).
Some sociologists have suggested that poverty is based on a culture of poverty, a set of norms, values, and beliefs that encourage and perpetuate poverty. In this view, moral deficiencies of individuals or their families lead to a life of poverty. Oscar Lewis (1969), Edward Banfield (1974), and Myron Magnet ([1993] 2000) argue that the poor are socialized differently (e.g., living from moment to moment) and are likely to pass these values on to their children. Patterns of generational poverty—poor parents have poor children, who in turn become poor adults, and so on—seem to support this theory.
Yet the culture of poverty explanation has been widely criticized. Opponents argue that there is no evidence that the poor have a different set of values and beliefs. This perspective defines poverty as a persistent state; that is, once you are poor, your values prohibit you from ever getting out of poverty. In fact, poverty data reveal that for most individuals and families, continuous spells of poverty are likely to last less than two years (Harris 1993).
Interactionists also focus on the public’s perception of welfare and of welfare recipients. Most Americans do not know any welfare recipients personally or have any direct contact with the welfare system. Their views on welfare are likely to be shaped by what they see on television and by what they read in newspapers and magazines (Weaver 2000). As a society, we have developed a sense of the “undeserving poor”; dependent mothers and fathers and nonworking recipients have become powerful negative symbols in society (Norris and Thompson 1995). Critics of social programs for the poor fear that the United States is becoming an entitlement society, creating a large segment of the population who would rather depend on government benefits than work (Sherman, Greenstein, and Ruffing 2012). During the 2012 presidential campaign, Governor Mitt Romney was secretly taped promoting this negative rhetoric of public assistance. In his comments, Romney referred to the 47% of Americans who were dependent on the government and who believed they were victims. Romney said his job was “not to worry about those people.” His statements are at odds with welfare program facts: more than 90% of those on entitlement and mandatory programs are the elderly (people 65 and over), disabled, and members of working households (Sherman et al. 2012).
Martin Gilens (1999) explains that welfare has become a code word for race. Race and racism are important in understanding public and political support for antipoverty programs (Lieberman 1998; Neubeck and Cazenave 2001; Quadagno 1994). Gilens states that Americans perceive welfare as a Black phenomenon, believing that Blacks make up 50% of the poor population (compared with an actual 25%). This belief is exacerbated by the notion that Blacks are on welfare not because of blocked opportunities, but largely because of their lack of effort.
Gilens (1999) asserts that the news media are primarily responsible for building this image of Black poverty, that is, for the “racialization of poverty.” During the War on Poverty in the early 1960s, the media focused on White rural America, but as the civil rights movement began to build in the mid-1960s, the media turned their attention to urban poverty, and the racial character of poverty coverage changed. Between 1965 and 1967, sensationalized portrayals of Black poverty were used to depict the waste, inefficiency, or abuse of the welfare system, whereas positive coverage of poverty was more likely to include pictures and portrayals of Whites. After 1967 and for most of the following three decades, larger proportions of Blacks appeared in news coverage of most poverty topics. “Black faces are unlikely to be found in media stories on the most sympathetic subgroups of the poor, just as they are comparatively absent from media coverage of poverty during times of heightened sympathy for the poor” (Gilens 1999:132). According to Gilens, this exaggerated link between Blacks and poverty is a serious obstacle to public support for antipoverty programs.
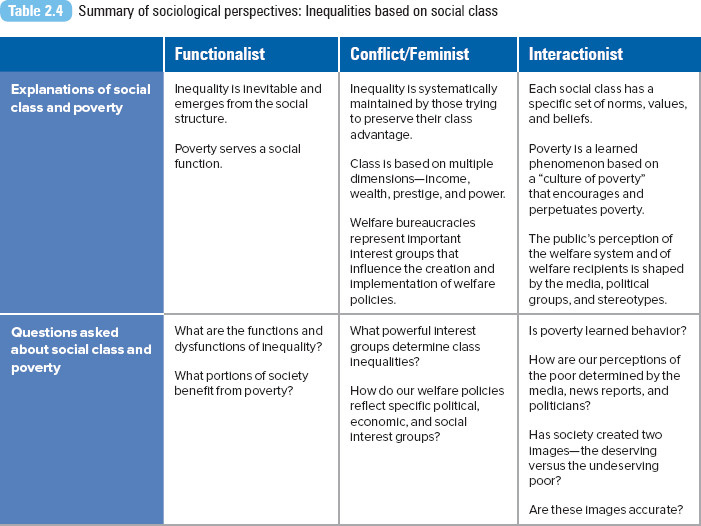
A review of all sociological perspectives is presented in Table 2.4.

Income Inequality by State
The Consequences of Poverty
The following section is not an exhaustive list of the consequences of poverty. Remaining chapters will also highlight the relationship between social class and the experience of a specific social problem (such as educational attainment or access to health care). Given the intersectionality of all the bases of inequality covered in this section of the book, there is a persistent overlap in the experience of social problems as a result of one’s class, race, gender, sexual orientation, and age.
Food Insecurity and Hunger
About 15% of households, or 17.6 million American families, were food insecure for at least some time during 2011 to 2012 (Coleman-Jensen, Nord, and Singh 2013). Analysts attribute the increase to rising unemployment rates and food prices. Food insecure means that these families did not always have access to enough food for all members of the household to enjoy active and healthy lives. Fifty-nine percent of the food-insecure households said they had participated during the previous month in one or more federal food and nutrition assistance programs—the National School Lunch Program, the Supplemental Nutrition Assistance Program (described below), or the Special Supplemental Nutrition Program for Women, Infants and Children. The prevalence of food insecurity is higher for certain groups: single-female-headed households with children (35.4%), Black households (24.6%), Hispanic households (23.3%), and households with income below the poverty line (40.9%) (Coleman-Jensen et al. 2013). Food insecurity was more common in large cities and rural areas than in suburban areas and exurban areas around larger cities.
The USDA provided food assistance through one of 17 public food assistance programs. The U.S. food stamp program, now called the Supplemental Nutrition Assistance Program (SNAP), is the nation’s largest nutrition program for low-income individuals and families. During 2013, the program served an average of 47 million low-income Americans each month. The average monthly benefit was $133 per person, $275 per household. Food stamps cannot be used to buy nonfood items (personal hygiene supplies, paper products), alcoholic beverages, vitamins and medicines, hot food products, or any food that will be eaten in the store. SNAP is described as a powerful tool in fighting poverty by the Center on Budget and Policy Priorities (2013a). Serving as a bridge program, SNAP provides temporary assistance to individuals and families during periods of unemployment or a crisis (Center on Budget and Policy Priorities 2013a). Although SNAP and other USDA programs have been shown to be effective in improving the purchasing power and nutritional status of specific populations, a large segment of low-income Americans are not being adequately served or served at all by these programs. In 2012, only 67% of individuals who qualified for SNAP benefits participated in the program (Center on Budget and Policy Priorities 2013a).
For one week in 2007, Governor Theodore R. Kulongoski (D-OR) challenged fellow Oregonians to join him and his wife Mary in living on an average Oregon food stamp budget of $21 per week per person, or $3 a day. His efforts drew state, national, and global attention to food insecurity in his home state of Oregon, as well as the need for the federal government to preserve the current level of food stamp benefits. Before his challenge week, the governor and his wife had each spent an average of $51 per week on food, not including his meals while at work or during official functions; during his challenge week, their final food bill was $20.97 per person. Governor Kulongoski reported several challenges he and his wife experienced throughout the week—the demoralizing experience of not having enough to pay for all the food in their cart, having to make tough decisions on the quality and amount of food they could purchase, and experiencing hunger throughout the week as their food supply ran out (Kulongoski 2007). Since Kulongoski’s challenge, there have been annual food stamp budget challenges sponsored by faith leaders, politicians, and news reporters, highlighting the difficulties of eating a healthy and sustainable diet on the standard food stamp allotments.
Republican congressional leaders supported deep cuts in the SNAP program in 2013, arguing that the program had grown too big and expensive and was another source of government dependency. Republicans advocated closing program loopholes and adding work requirements for recipients. When the 2014 Farm Bill was signed into law, it included $8.7 billion in cuts in the SNAP budget over 10 years, with some pilot work programs (Grovum 2014). Policy analysts predicted that the reduction would affect 850,000 recipients in 14 states and the District of Columbia, reducing their monthly benefit by an average of $90. However, most have been able to preserve their SNAP benefits by relying on a SNAP loophole, the “Heat and Eat” provision. Under the provision, a household is entitled to more food aid if it is enrolled in the federally funded Low Income Home Energy Assistance Program (LIHEAP). Previously, households would be eligible for LIHEAP if they received a minimum of $1.00 per year. Congress changed the law, increasing the minimum to $20 per year. In response, states increased their LIHEAP funding to support the new federal minimum, thus ensuring SNAP eligibility to more individuals and families (Grovum 2014).
As reported by Briefel et al. (2003), food pantries and emergency kitchens play an important role in the nutritional safety net for America’s low-income and needy populations. These organizations are part of the Emergency Food Assistance System, a network of private organizations operating with some federal support. Almost one third of pantry client households and two fifths of kitchen client households are at or below 50% of the poverty line. The mean monthly income is $781 for pantry client households and $708 for kitchen client households. Food pantries considered by Briefel et al. were likely to serve families with children (45% of households included children), whereas emergency kitchens were likely to serve men living alone (38%) or single adults living with other adults (18%).
The U.S. Conference of Mayors (2014) reported that emergency food assistance had increased by an average of 7% in 25 surveyed cities. Unemployment was identified as the leading cause of hunger, followed by low wages, poverty, and high housing costs. Fifty-six percent of individuals requesting emergency food assistance were families. In 2013–2014, an average of 27% of the people needing emergency food assistance did not receive it.
Insecurity Persists Despite Food Stamps
Food Insecurity and Hunger
Absolute Poverty
Affordable Housing
Although most Americans still aspire to own a home, for many poor and working Americans, home ownership is just a dream (Freeman 2002). Despite the decline in home sales and values, housing affordability has declined (Savage 1999). The generally accepted definition of affordability is for a family to pay no more than 28% of its annual income on housing (30% for a rental unit). Nearly one in four working households (households where individuals work more than 20 hours per week and have a household income of no more than 120% of the median income in the area) spends more than half its income on housing costs (Williams 2012). Renters are more than twice as likely as homeowners to pay more than half their income for housing (Fischer and Sard 2013).
Lance Freeman (2002) explains that because housing is the single largest expenditure for most households, “housing affordability has the potential to affect all domains of life that are subject to cost constraints, including health” (p. 710). Most families pay their rent first, buying basic needs such as food, clothing, and health care with what they have left. The lack of public assistance, increasing prices, slow wage growth, and a limited inventory of affordable apartments and houses make it nearly impossible for some to find adequate housing (Pugh 2007).
The combination of low earnings and scarce housing assistance results in serious housing problems for the working poor. According to the National Low Income Housing Coalition (Arnold et al. 2014), there is no state where a full-time minimum-wage worker can afford a modest one- or two-bedroom unit. In 2014, it took, on average, 2.6 minimum-wage jobs to afford a modest two-bedroom unit. About 50% of all renters were using over 30% of their income for housing (Arnold et al. 2014). Increasing the minimum wage would not solve the affordable housing problem. Low-income households remain at higher risk for experiencing housing instability, eviction, poor housing conditions, and homelessness.
Consider the housing situation of Alice Greenwood and her 6-year-old son, Makalii (Magin 2006). When the home she had rented for 30 years for $300 a month was sold, she and her son joined some 1,000 people living in tents along the 13-mile stretch of beaches on the Waianae Coast of Oahu, Hawaii. In Waianae, homes that had rented for $200 to $300 per month a couple of years before now average more than $1,000 per month. For 2007, the median price of a home on Oahu was $665,000. Most of Greenwood’s tent neighbors are employed in service and construction sectors. The state’s homeless shelter is not a viable option for Greenwood and other beach residents—it would take them away from their communities (it is about 10 miles from the beach park) and would make commuting difficult (it is located several miles from the nearest bus route).
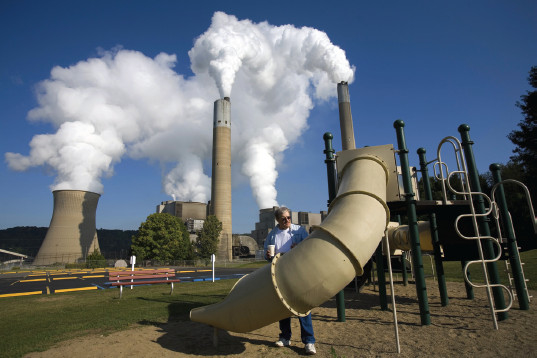
Pictured here is a playground in the shadows of smoke and steam vapor stacks at the Bruce Mansfield Power Plant in Shippingport, Pennsylvania. The Bruce Mansfield Power Plant is one of 12 large coal plants in the U.S. emitting tons of carbon dioxide and particulate pollution annually. Fine particulate pollution has been associated with asthma attacks and heart and lung disease.
Robert Nickelsberg/Getty Images
Health
Regardless of the country where a person lives, social class is a major determinant of one’s health and life expectancy (Braveman and Tarimo 2002); those lower on the socioeconomic ladder have worse health than those above them (Marmot 2004). The link between class and health has been confirmed in studies conducted in Australia, Canada, Great Britain, the United States, and Western Europe (Cockerman 2004). Although no factor has been singled out as the primary link between socioeconomic position and health, scholars have offered many factors—standard of living, work conditions, housing conditions, access to better-quality food, leisure activities, and the social and psychological connections with others at work, at home, or in the community—to explain the relationship (Krieger, Williams, and Moss 1997). According to Nancy Krieger and her colleagues (1997: 343) “poor living and working conditions impair health and shorten lives.”
Rose Weitz (2001) offers several explanations for the unhealthy relationship between poverty and illness. The type of work available to poorly educated people can cause illness or death by exposing them to hazardous conditions. Poor and middle-class individuals who live in poor neighborhoods are exposed to air, noise, water, and chemical pollution that can increase rates of morbidity and mortality. Inadequate and unsafe housing contributes to infectious and chronic diseases, injuries, and illnesses, including lead poisoning when children eat peeling paint. The diet of the poor increases the risk of illness. The poor have little time or opportunity to practice healthy activities such as exercise, and because of life stresses, they may also be encouraged to adopt behaviors that might further endanger their health. Finally, poverty limits individual access to preventative and therapeutic health care.
The relationship between health and social class afflicts those most vulnerable, the young. Children in poor or near-poor families are two to three times more likely not to have a usual source of health care than are children in nonpoor families (Federal Interagency Forum on Child and Family Statistics 2007). Access to a regular doctor or care facility for physical examinations, preventative care, screening, and immunizations can facilitate the timely and appropriate use of pediatric services for youth. Even children on public insurance (which includes Medicaid and the State Children’s Health Insurance Program) are more likely not to have a usual source of care than are children with private insurance. Children in families below the poverty level have lower rates of immunization and yearly dental checkups (both basic preventative care practices) than do children at or above the poverty level (Federal Interagency Forum on Child and Family Statistics 2007). Refer to Chapter 10, “Health and Medicine,” for more on the impact of social class on health care access and quality.
Responding to Class Inequalities
U.S. Welfare Policy
Throughout the 20th century, U.S. welfare policy has been caught between two values: the desire to help those who cannot help themselves and the concern that assistance could create dependency (Weil and Feingold 2002). The centerpiece of the social welfare system was established by the passage of the Social Security Act of 1935. The act endorsed a system of assistance programs that would provide for Americans who could not care for themselves: widows, the elderly, the unemployed, and the poor.
Under President Franklin D. Roosevelt’s New Deal, assistance was provided in four categories: general relief, work relief, social insurance, and categorical assistance. General relief was given to those who were not able to work; most of the people receiving general relief were single men. Work relief programs gave government jobs to those who were unemployed through programs such as the Civilian Conservation Corps and the Works Progress Administration. Social insurance programs included social security and unemployment compensation. Categorical assistance was given to poor families with dependent children, to the blind, and to the elderly. To serve this group, the original welfare assistance program, Aid to Dependent Children (later renamed AFDC), was created (Cammisa 1998).
Categorical programs became the most controversial, and the social insurance programs were the most popular. It was widely believed that social insurance paid people for working, whereas categorical programs paid people for not working. Shortly after these programs were implemented, officials became concerned that individuals might become dependent on government relief (Cammisa 1998). Even President Roosevelt (quoted in Patterson 1981) expressed his doubts about the system he helped create: “Continued dependence upon relief induces a spiritual and moral disintegration fundamentally destructive to the national fibre. To dole out relief in this way is to administer a narcotic, a subtle destroyer of the human spirit” (p. 60).
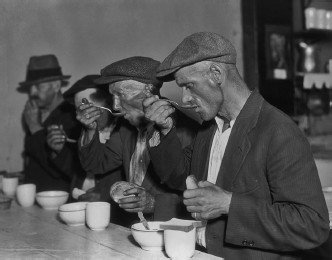
Soup kitchens emerged in the United States during the Great Depression, operated primarily by churches and local charities. Soup and bread meals were easy to to prepare and serve to the poor and unemployed.
© HultonArchive/istock
The next great expansion of the welfare system occurred in the mid-1960s, when President Lyndon Johnson (1965) declared a War on Poverty and implemented his plan to create a Great Society. Rehabilitation of the poor was the cornerstone of Johnson’s policies, and what followed was an explosion of social programs: Head Start, Upward Bound, Neighborhood Youth Corps, Job Corps, public housing, and affirmative action. Although poverty was not completely eliminated, defenders of the Great Society say that these programs alleviated poverty, reduced racial discrimination, reduced the stigma attached to being poor, and helped standardize government assistance to the poor. Conversely, opponents claim that these programs coddled the poor and created a generation that expected entitlements from the government (Cammisa 1998).
During the more than 50 years when the AFDC program operated, welfare rolls were increasing, and, even worse, recipients were staying on government assistance for longer periods. In a strange irony, welfare, the solution for the problem of poverty, became a problem itself (Norris and Thompson 1995). Between 1986 and 1996, many states began to experiment with welfare reforms. Wisconsin was the first state to implement such a reform with a program that included work requirements, benefit limits, and employment goals.
In 1996, PRWORA was passed with a new focus on helping clients achieve self-sufficiency through employment. PRWORA was a bipartisan welfare reform plan to reduce recipients’ dependence on government assistance through strict work requirements and welfare time limits. Replacing AFDC, the new welfare program is called Temporary Assistance for Needy Families (TANF). Instead of treating assistance as an entitlement, as it was under AFDC, TANF declares that government help is temporary and has to be earned. Under TANF, there is a federal lifetime limit of 60 months (five years) of assistance, although states may put shorter limits on benefits. PRWORA also gave states primary responsibility for designing their assistance programs and for determining eligibility and benefits.
The act had an immediate effect on the number of poor. When PRWORA became law, the poverty rate was 13.7%; 36.5 million individuals were poor, by the government’s definition. A year later, the rate had declined to 13.3%, and 35.6 million were poor. Rates declined to their lowest point in 2000, 11.3% or 31.6 million. According to the U.S. Census Bureau, the 2000 poverty rate was the lowest since 1979 (DeNavas-Walt et al. 2007).
PRWORA was reauthorized under the Deficit Reduction Act of 2005. The reauthorization requires states to engage more TANF clients in productive work activities leading to self-sufficiency. The five-year cumulative lifetime limit for TANF recipients remains unchanged. Funding was also provided for healthy marriage and responsible fatherhood initiatives (U.S. Department of Health and Human Services 2006).
During the 2007–2009 recession, there was increased concern that poverty was on the rise, straining the safety net of TANF and other government support programs. A depressed economy challenges everyone, but especially those already poor. According to Austin Nichols (2011), history shows that unemployment and poverty rates continue to rise after a recession ends. The effects of poverty deepen over time as individuals exhaust private resources and temporary benefits. The rate of deep poverty (incomes less than half the poverty level) increased from 6.3% in 2009 to 6.7% in 2010. Nichols (2011) advises, “Federal government initiatives are laudable, but cash-strapped families scarred by the labor market and housing market collapses will need more direct help, temporary or not” (p. 2).
President Lyndon Johnson’s War on Poverty
Life After Welfare
A strong economy and increased aid to low-income working families contributed to the immediate decline in welfare caseloads after PRWORA (Besharov 2002). Welfare officials often point to how the first to leave welfare were those with the most employable skills. However, research indicates that the early employment success of welfare reform diminished as the economy faltered. According to the Urban Institute, 32% of welfare recipients were in paid jobs in 1999, but the number had fallen to 28% by 2002. Employment also declined for those who left welfare, from 50% in 1999 to 42% in 2002 (Zedlewski and Loprest 2003).
Under federal law, states are required to engage at least 50% of TANF families in work activities (e.g., employment or job search). The law limits the degree to which education and training count toward the work participation rate. According to the Center for Women Policy Studies (2002), after PRWORA, college enrollment among low-income women declined. Yet studies indicate that former TANF recipients with a college education are more likely to stay employed and less likely to return to welfare. For example, a study among former welfare recipients in Oregon found that only 52% of those with less than a high school diploma were employed after two years. In contrast, 90% of former TANF recipients with a bachelor’s degree were still employed. Since 1996, 49 states—Oklahoma and the District of Columbia are exceptions—passed legislation to allow secondary education to count as activity under PRWORA.
Sandra Morgen, Joan Acker, and Jill Weigt (2010) examined the consequences of welfare reform among poor individuals and their families in Oregon from 1998 to 2002. Though more than half to three quarters of the TANF clients they followed were employed when they left the welfare rolls, they were working in low-wage occupations and earning wages so low that almost half had incomes below the official poverty line. Once off welfare, the majority of families continued to struggle to make ends meet and were forced to make tough decisions—for example, putting off medical care, skipping meals to stretch their food budget, or dealing with their utilities being turned off. Many continued to rely on benefits from Oregon’s Adult and Family Services. The sociologists concluded that self-sufficiency was still elusive for many families. “Having to depend on low-wage work leaves millions of families facing a combination of job insecurity, inadequate household income, long hours of work, unsatisfactory child care arrangements, and lack of health insurance, sick leave or retirement benefits” (Morgen et al. 2010:148).
Though TANF evaluation studies reveal overall increases in employment, income, and earnings of families formerly on welfare, many families remained poor or near poor and struggled to maintain employment (Hennessy 2005) even before the 2007 recession. In their five-year study of TANF recipients in New Jersey, Robert Wood, Quinn Moore, and Anu Rangarajan (2008) found that recipients experienced economic progress and setbacks in the years after entering the program. On average, recipients’ employment and income levels increased and poverty levels declined for recipients during the five-year period. However, their average income levels were low, about $20,000 per year, and almost half had incomes below the poverty line. Many recipients exited the labor market or returned to poverty sometime during the five years they were tracked. Most at risk were those without a high school degree, with limited work histories, and with work-limiting health conditions.
Eugenie Hildebrandt and Sheryl Kelber (2012) examined the experiences of women who were in different stages of TANF participation in a large Wisconsin urban county. Wisconsin was one of the first stages to experiment with work-based welfare and program limits. Their study included women who had exhausted their time limit. Hildebrandt and Kelber discovered that the women were unable to meet the needs of their families during or after being in the TANF program. They concluded, “TANF does not have the depth, breadth, or flexibility to adequately address multiple, complex barriers to work” (p. 138). “Barriers of limited education and work skills for well-paying jobs, chronic mental and physical health problems, and personal and family challenges left them few options for escaping poverty” (p. 139). Among the women in the terminated group, the majority had chronic health problems (93%) and depressive symptoms (78%).
In 2012, the Obama administration gave states more control over how they administer their TANF program, instituting an experimental program for states to “test alternative and innovative strategies, policies and procedures that are designed to improve employment outcomes for needy families” (U.S. Department of Health and Human Services 2012).
Voices in the Community

Mauricio Lim Miller
Mauricio Lim Miller is the founder and CEO of the Family Independence Initiative (FII), a nontraditional antipoverty program. FII was launched as a research project by Lim Miller and then Oakland Mayor Jerry Brown in 2001. The program allows low-income families to find their own way to self-sufficiency, establishing their own initiatives and finding success. Instead of telling poor families what to do, FII provides a context in which families “can discover for themselves what’s important to them and how they can best achieve those goals” (Burak 2001:27). According to Lim Miller (quoted in Bornstein 2011),
when you come into a community that is vulnerable with professionals with power and preset ideas, it is overpowering to families and it can hold them back. Nobody wants to hear that because we are all good guys. But the focus on need undermines our ability to see their strengths—and their ability to see their own strengths.
The program promotes the importance of connections through social networks, greater choices, and the ability to create economic capital.
FII began with 25 families in three cohorts—8 African American families, 6 Salvadoran refugee families, and 11 Iu Mien families (Bornstein 2011). Family groups were asked to write down their goals (e.g., improving child’s grades, starting business, buying a home), with FII promising to pay each family $30 for every success, a maximum of $200 per month. Families need to work on their plans together and report their progress to each other and to FII staff. The program structure builds a social network and social capital among the participating families (Burak 2011). The program is unstructured, but “the families have done well because we give them room to do whatever they feel they need to do to get ahead,” says Lim (quoted in Fessler 2012).
Assessment data revealed that among the first group of 25 families, household incomes increased 25% after two years. Even after FII’s payments stopped, incomes continued to increase, up to 40% higher than the baseline. Lim Miller also established his program in Hawaii and San Francisco. Client success was documented at these sites, with family incomes increasing by 23% and savings by 240% (Bornstein 2011).
In 2010, Lim Miller was invited to join President Obama’s White House Council for Community Solutions, a group of individuals who have “dedicated their lives and careers to civic engagement and social innovation” (White House 2010).
As of 2014, the program had established six program sites.
Earned Income Tax Credit
Enacted in 1975, the Earned Income Tax Credit (EITC) program provides federal tax relief for low-income working families, especially those with children. The credit reduces the amount of federal tax owed and usually results in a tax refund for those who qualify. Similar programs are offered in the United Kingdom, Canada, France, and New Zealand. To qualify for the U.S. program, adults must be employed. A single parent with one child who had family income of less than $37,870 (or $43,210 for a married couple with one child) in 2013 could get a credit of as much as $3,250. The EITC can be claimed for children under age 19, or under age 24 if they are still in college.
Expansions of the program in the late 1980s and early 1990s made the credit more generous for families with two or more children. In 1994, a small credit was made available to low-income families without children (Freidman 2000). Receipt of the EITC does not affect receipt of other programs such as food stamp benefits, Medicaid, or housing subsidies. In 2009, the EITC was expanded to low-earning single and married workers without children, noncustodial parents, and parents with adult independent children.
Supporters of the EITC argue that the program strengthens family self-sufficiency, provides families with more disposable income, and encourages work among welfare recipients. The program acts as a short-term safety net during periods of shock to income (e.g., loss of job) or family structure (e.g., divorce) or as a long-term income support for multiple spells of income loss or poverty (Dowd and Horowitz 2011). Families use their credits to cover basic necessities, home repair, vehicle maintenance, or education expenses (Center on Budget and Policy Priorities 2012). Almost half of EITC recipients planned to save all or part of their refund (Smeeding, Ross, and O’Conner 1999). The program is credited with lifting more children out of poverty than any other government program (Llobrera and Zahradnik 2004).
In 2014, 25 states and the District of Columbia offered a state-level earned income credit for residents, usually a percentage of the federal credit.
Changing the Definition—Redefining Poverty
The calculation of the U.S. poverty measure has been described as outdated due to how consumption patterns and the types of family needs have changed. For example, the cost of housing now constitutes a larger proportion of household expenses than it did in the 1960s (Ruggles 1990). Due to the rising costs of goods and services other than food (the primary basis for the current poverty calculation), the poverty measure underestimates the income needed for all household necessities (Christopher 2005).
In 1995, a panel of the National Academy of Sciences (NAS) called for a new poverty measure to include the three basic categories of food, clothing, and shelter (and utilities) and a small amount to cover other needs such as household supplies, child care, personal care, and non-work-related transportation. Because the census measure does not show how taxes, noncash benefits, and work-related child care and medical expenses affect people’s well-being, the NAS panel cautioned that the current poverty measure cannot reflect how policy changes in these areas affect the poor. In addition, the measure does not consider how the cost of basic goods (food and shelter) has changed since the 1960s. As we have already discussed, the federal poverty measurement assumes that costs are the same across most of the states, except Hawaii and Alaska. It does not make sense that a family of four in Manhattan, New York, is expected to spend the same amount of money for food, clothing, and shelter as a family of four in Manhattan, Kansas (Bhargava and Kuriansky 2002).
The U.S. Census Bureau has been calculating experimental measures of poverty since 1999. For 2001, in measuring the overall poverty rate, the experimental measures reported higher levels of poverty, especially when accounting for geographic differences in housing costs and for medical out-of-pocket expenses. Although the official rate was 11.7%, experimental measures varied between 12.3% and 12.9%. When looking at the poverty rate for specific groups, the experimental measures tend to present a poverty population that looks more like the total population in terms of its mix of people: the elderly, White non-Hispanic individuals, and Hispanics (Short 2001).
In 2011, the U.S. Census Bureau released the Supplemental Poverty Measure (SPM). Rebecca Blank (2011) explains that the SPM provides an alternative way to look at economic need among the lowest-income families. While adjusting for geographic differences, the measure considers the dollar amount spent on food, clothing, utilities and housing, medical needs, and work-related transportation. The measure also considers household income resources, including noncash government benefits such as SNAP and the earned-income tax credit. The official poverty statistics, according to Blank, are incomplete when it comes to reporting the effect of the government policy on the poor. For example, when SNAP benefits are counted as income, they lift almost 4 million people above the poverty line and reduce poverty for millions more (Center on Budget and Policy Priorities 2013b).
Though the SPM will not replace the official measure, it has led to a reexamination of the extent of poverty in the United States. Results showed higher SPM poverty rates than the official measure for most groups. For 2010, according to the official poverty measure, there were 46.6 million people (or 15.2% of the population) living in poverty. With the SPM calculation, the poverty estimate increased to 49.1 million (16%). The distribution of poverty also changes, with higher proportions of poor among adults aged 18–64 years and adults 65 and older, married-couple families and families with male householders, Whites, Asians, the foreign born, homeowners with mortgages, and those with private health insurance (Short 2011).
Sociology at Work

Critical Thinking
Your college education involves more than just learning new things; it also includes developing the skills to apply your new knowledge. This skill is referred to as critical thinking. The American Association of Colleges and Universities (AAC&U 2013) defines critical thinking as “a habit of the mind characterized by the comprehensive exploration of issues, ideas, artifacts and events before accepting or formulating an opinion or conclusion.” A good critical thinker is able to apply these habits in “various and changing situations encountered in all walks of life” (AAC&U 2013). What does critical thinking look like? Critical thinking does not consist of one specific activity or outcome; rather it involves the use of reason, logic, and evidence to solve a problem, to evaluate a claim or situation, or to investigate a new aspect of our social world.
Take, for example, the subject of this chapter: social class. Most sociological discussions about social class begin with a discussion on Karl Marx. A critical thinker would not simply accept Marx’s theory as the only explanation about social class, but would also consider alternative perspectives and explanations, some that might even disagree with Marx. A critical thinker would look for evidence, considering whether historical data support or refute Marx’s theory on the rise of the proletariat class. Critical thinking can also involve applying Marx’s theory to the way that we work now. What would Marx think about our solutions for poverty?
Critical thinking is valued in the new workplace. According to a 2013 survey of business and nonprofit leaders, 75% of respondents said they wanted more educational emphasis on critical thinking, along with complex problem solving, written and oral communication, and applied knowledge in real-world settings (Hart Research Associates 2013).
How have you applied critical thinking in your sociology courses?
How could you use this skill in the workplace?
Chapter Review
- 2.1 Explain the different definitions of poverty
Absolute poverty refers to a lack of basic necessities, such as food, shelter, and income. Relative poverty refers to a situation where people fail to achieve the average income or lifestyle enjoyed by the rest of society. Relative poverty emphasizes the inequality of income and the growing gap between the richest and poorest Americans. The poverty threshold is the original federal poverty measure developed by the Social Security Administration and is used for estimating the number of people in poverty annually by the Census Bureau. Poverty guidelines (issued each year by the U.S. Department of Health and Human Services) are used for determining family or individual eligibility for federal programs.
- 2.2 Compare the four sociological perspectives on social class and poverty
Functionalists observe that class inequality is a product of our social structure. Lower wages and poverty are natural consequences of this system of stratification. Conflict theorists assert that poverty exists because those in power want to maintain and expand their base of power and interests, with little left to share with others. Welfare bureaucracies—local, state, and national—represent important interest groups that influence the creation and implementation of welfare policies. Feminist scholars argue that the welfare state is an arena of political struggle. The drive to maintain male dominance and the patriarchal family is assumed to be the principal force shaping the formation, implementation, and outcomes of U.S. welfare policy. Interactionists explain how poverty is a learned phenomenon. This perspective also focuses on the public’s perceptions about poverty.
- 2.3 Identify two consequences of poverty
Food insecurity is defined as food insufficient for all family members to enjoy active and healthy lives for at least some time during the year. For a variety of reasons, poor families encounter higher food prices and a smaller selection of food than other families. Housing is another problem; the combination of low earnings and scarce housing assistance results in serious housing problems for the working poor.
- 2.4 Explain the evolution of U.S. welfare policy
The centerpiece of the social welfare system was established by the passage of the Social Security Act of 1935. The act endorsed a system of assistance programs that would provide for Americans who could not care for themselves: widows, the elderly, the unemployed, and the poor. Welfare policies and programs were expanded under Franklin D. Roosevelt’s New Deal and Lyndon Johnson’s Great Society reforms, yet policy makers grew concerned about increasing dependence on social welfare programming. A new era of social welfare began with the 1996 Personal Responsibility and Work Opportunity Reconciliation Act. PRWORA was a bipartisan welfare reform plan to reduce recipients’ dependence on government assistance through strict work requirements and welfare time limits.
- 2.5 Assess whether life after welfare has improved since the passage of PRWORA
PRWORA had an immediate effect in reducing the number of people on welfare. However, although employment has increased among welfare recipients, many recipients have little education or work experience, have limited employment benefits, and continue to struggle to achieve self-sufficiency.
Key Terms
- absolute poverty, 34
- culture of poverty, 46
- distributive power, 45
- food insecure, 48
- income, 42
- life chances, 32
- poverty guidelines, 35
- poverty threshold, 34
- power, 43
- power elite, 43
- prestige, 43
- relative poverty, 34
- social inequality, 46
- social stratification, 41
- wealth, 42
Study Questions
- Examine the difference between income and wealth. Which do you think is the better measure of social class?
- How would you describe a middle-class lifestyle? What are its characteristics—housing, vacations, cars, and lifestyle? Estimate what it takes to lead this middle-class life.
- Review the different definitions of poverty (from sociologists and according to federal policy). What are the advantages and disadvantages of each?
- Functionalists assume that not everyone in society can and should be equal. Do you agree with this statement? Why or why not?
- How would Marx and Weber define your social status, that of Microsoft’s Bill Gates, and that of your sociology professor?
- How has the welfare system (past and present) discriminated against women?
- The chapter reviews three consequences of poverty—health care, food insecurity, and housing. Which do you think is most serious and why? What other consequences of poverty can you identify?

Sharpen your skills with SAGE edge at edge.sagepub.com/leonguerrero5e
SAGE edge provides a personalized approach to help you accomplish your coursework goals in an easy-to-use learning environment.